.png)
Proper perspective is key to success in many things in life, especially investing. A lot of investors tend to dramatically change their holdings at exactly the wrong time, costing themselves a great deal of money. As any long-term investor can verify, fixating on short-term losses often leads to poor behavior.
A case in point is 2022, which was a difficult year. The S&P 500 lost -18.1% (Vernon, 2023)1. FAANG stocks struggled as well, Amazon lost -51%, Apple lost -28%, Meta lost -65%, and Netflix was down-51.1% (Forbes, 2022)2.
Focusing on these declines may lead some to want to trade out of losing positions. The psychological term is called “loss aversion bias,” which is “a tendency to avoid losses overachieving equivalent gains” (Aguilar, 2021)3.
Many investors are inclined to make major changes to their investment strategies to avert losing more. A great example of this is in, Your Money and Your Brain by Jason Zweig (Zweig 2007)4. In the book, Zweig writes that investing and sports have the same psychological bias. Football coaches almost always punt the ball on fourth, even though statistics prove they would be better off trying for first down. However, if you don’t punt and turn over the ball, your opponents can really hurt you. “So, the fact that you will succeed most of the time on fourth down matters less than the regret you will feel, and the blame you will take, if you fail this time,” he says. “This same instinct drives millions of retirement investors to keep their money buried in cash and bonds; they are afraid of the regret they will feel if they invest in stocks right now before a market crash.”
However, these actions can lead to devastating outcomes for their investments. Exhibit 1, provided by Dimensional Fund Advisors (DFA)5, shows that if you invested a hypothetical $1,000 in the Russell 3000 Index for a 25-year period and if you decided to time the market or avert your long-term strategy to avoid further losses in periods of six months, three months, one month, and one week, how much you would have lost in return?
Another hypothetical example is from a 2021 Dalbar study. During the 30-year period since 1992, the average investor return has been 7.13% annualized, while the S&P 500 returned 10.65% (Connely, 2023)6. In 2018, there were two market corrections, while the average investor lost twice as much as the S&P 500 index according to Dalbar (Aguilar, 2021)3.
All these statistics show how difficult it is for investors to keep emotions out of their financial decision-making. History has repeatedly shown, as demonstrated from studies referenced in this article, that if investors stick with their long-term plan they will be rewarded with a greater return.
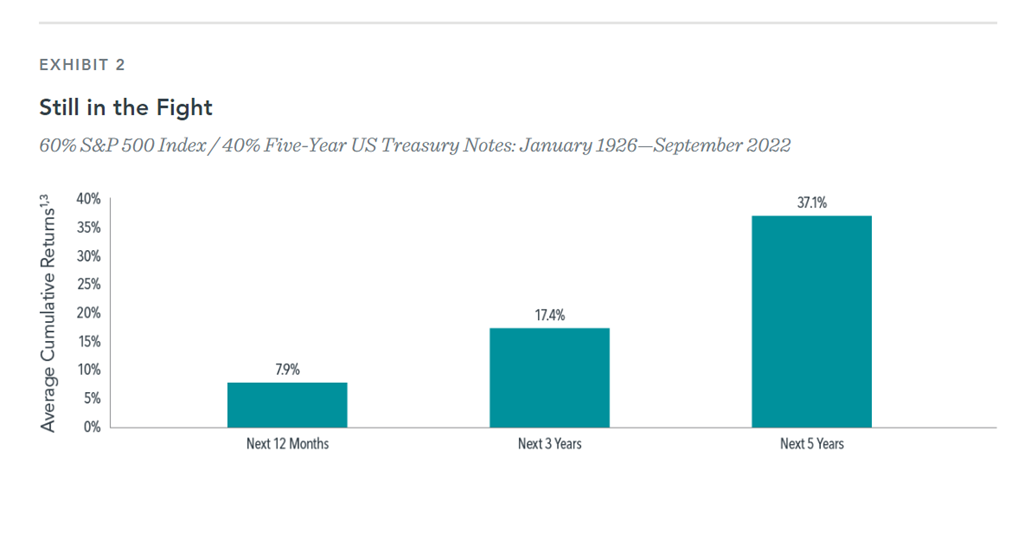
In Exhibit 2, provided by DFA, the portfolio is a 60% S&P 500 index and 40% in Five Year U.S. Treasury Notes from 1926-2022 after a decline of 10% or more. The next 12-month period is a 7.9% annualized cumulative return, the three-year period is 17.4%, and the five-year period is 37.1%.
“A loss that seems severe over one measurement period may feel lighter when you look at it over a different horizon; the farther back you measure, the better” (Zweig, 2023)7. Investors who have a plan, know how much they are trying to make, and how much volatility to expect, should anticipate a greater likelihood of positive results than those who let their emotions lead them to sell investments after declines. Further, a good advisor helps keep their clients from falling into traps that may lead to getting lower returns than markets have provided.
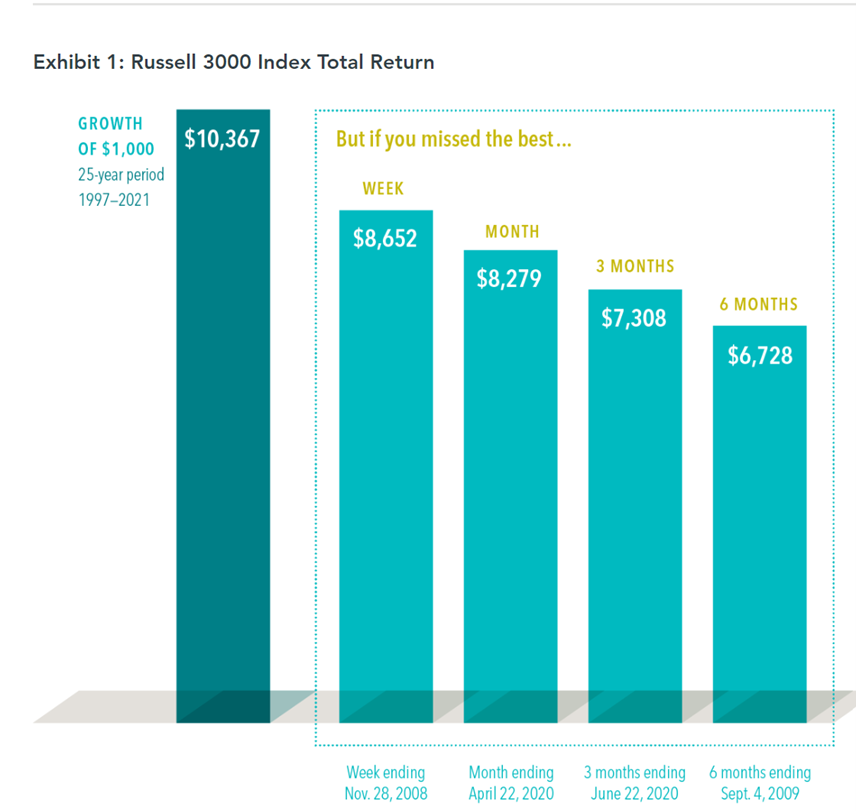 Source: Dimensional Fund Advisors. Past performance, including hypothetical performance, is not a guarantee of future results. All data is from sources believed to be reliable but cannot be guaranteed or warranted.
Source: Dimensional Fund Advisors. Past performance, including hypothetical performance, is not a guarantee of future results. All data is from sources believed to be reliable but cannot be guaranteed or warranted.
References:
1Vernon, S. (January 4, 2023). The S&P 500 Lost more Than 18% in 2022: Should Retirees be Worried? Retrieved from: https://www.forbes.com/sites/stevevernon/2023/01/04/the-sp-500-lost-more-than-18-in-2022-should-retirees-be-worried/?sh=3417a2a51ffc
2Forbes. (December 28, 2022). FAANG Stocks Time at The Top Could Be Over- Here’s What Analyst Expect in 2023. Retrieved from: https://www.forbes.com/sites/qai/2022/12/28/faang-stocks-time-at-the-top-could-be-overheres-what-analysts-expect-in-2023/?sh=5387b9135d78
3Aguilar, O. (November 02, 2021). Fundamentals of Behavioral Finance: Loss Aversion Bias. Retrieved from: https://www.schwabassetmanagement.com/content/loss-aversion-bias
4Zweig, J. (2008). Your money and your brain: How the new science of neuroeconomics can help make you rich. Simon & Schuster Paperbacks.
5Dimensional. (June 29, 2022). What Happens When You Fail at Market Timing. Retrieved from: What Happens When You Fail at Market Timing (dimensional.com)
6Connely, M. (February 14, 2023). Transforming The Investing Experience And Protecting Your Assets. Retrieved from: https://www.forbes.com/sites/top-financial-security-professional/2023/02/14/transforming-the-investing-experience-and-protecting-your-assets/?sh=5cd60bfb6016
For additional details on the Dalbar study and methodology behind the average investor, please see “Quantitative Analysis of Investor Behavior, 2021,” DALBAR, Inc. www.dalbar.com
7Zweig, J (May 19, 2023). Why You Keep Chasing the Wrong Stock Market. Retrieved from: https://www.wsj.com/articles/why-you-keep-chasing-the-wrong-stock-market-a246b609?mod=markets_major_pos9
Apella Capital, LLC (“Apella”), DBA Apella Wealth is an investment advisory firm registered with the Securities and Exchange Commission. The firm only transacts business in states where it is properly registered or excluded or exempt from registration requirements. Registration with the SEC or any state securities authority does not imply a certain level of skill or training. Apella Wealth provides this communication as a matter of general information. Any data or statistics quoted are from sources believed to be reliable but cannot be guaranteed or warranted. No current or future client should assume that any discussion or information contained in this article serves as the receipt of, or as a substitute for, personalized investment advice. As with any investment strategy, there is the possibility of profitability as well as loss. Past performance does not guarantee future results. All data is from sources believed to be reliable but cannot be guaranteed or warranted.
Index disclosure and definitions
All indexes have certain limitations. Investors cannot invest directly in an index. Indexes have no fees. Historical performance results for investment indexes generally do not reflect the deduction of transaction and/or custodial charges or the deduction of an investment management fee, the incurrence of which would have the effect of decreasing historical performance. Actual performance for client accounts may differ materially from the index portfolios.
Russell 3000 Index measures the performance of the 3,000 largest U.S. companies based on total market capitalization. This index represents approximately 98% of the total market capitalization of the U.S. equity market.
Standard & Poor’s 500 Index represents the 500 leading U.S. companies, approximately 80% of the total U.S. market capitalization.